Stats Tab
Purpose
The Stats tab provides real-time visualization of event resourcing status. It displays live statistics showing how positions are being filled across different zones, clubs, stands, and positions, helping organizers monitor staffing levels and identify gaps during the event.
Route
/manage/schedules/{schedule-id}/stats
Screenshot
Description
The Stats tab provides a hierarchical, color-coded view of all positions and their current staffing status.
Header Controls
Toggle Buttons
- ✕ Manual Refresh: Disable automatic data refreshing
- 👁 Show Positions / 🚫 Hide Positions: Toggle visibility of position details
- When enabled (green), shows all position rows
- When disabled (showing "Hide Positions"), collapses position details
- ⭐ Legend: Opens a popup explaining the color coding system
View Modes
- Zone: Organize statistics by zone (Default, Support, Backfill, etc.)
- Club: Organize statistics by club/organization (default view)
Actions
- 🔄 Refresh: Manually refresh the statistics data
Overall Summary
At the top right, a summary displays:
- Overall: 12 / 104 - Resources present out of total needed
- 12% - Percentage filled
Club View
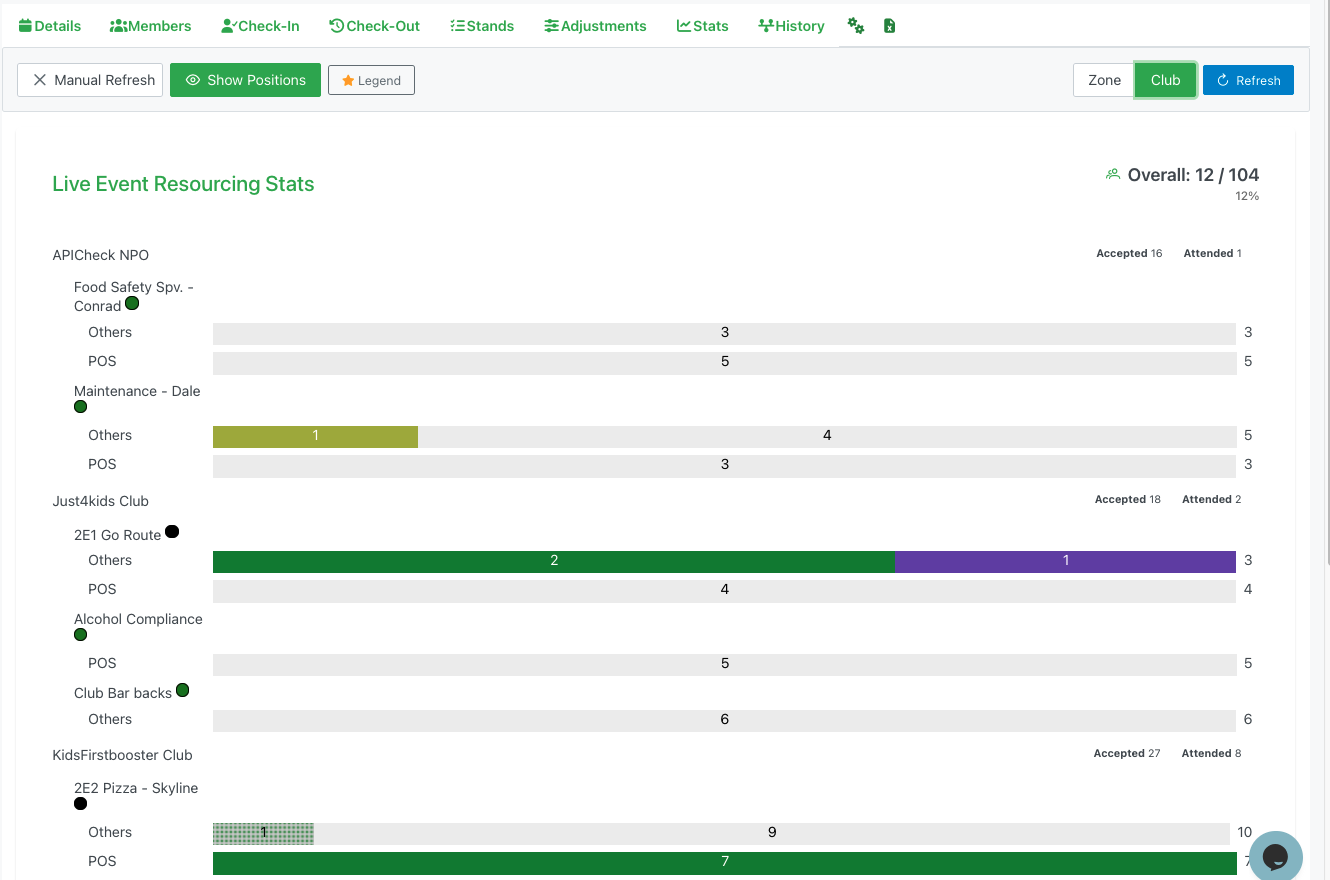
When viewing by Club, data is organized hierarchically:
Club/NPO Level
- Club Name: Organization name (e.g., "APICheck NPO", "Just4kids Club")
- Accepted: Count of resources who accepted assignments
- Attended: Count of resources who checked in
Stand Level (nested under Club)
- Stand Name: Stand location (e.g., "2E1 Go Route", "2E2 Pizza - Skyline")
- Status Indicator: Colored dot showing stand status
Position Level (nested under Stand)
- Position Name: Role type (e.g., "Others", "POS")
- Progress Bar: Visual representation of staffing status
- Green: Signed in resources
- Diagonal Stripes: Reassigned resources
- Yellow: Unannounced walk-ups
- Purple: Backfilled positions
- Gray: Missing/unfilled positions
- Need Number: Center number shows unfilled positions
- Total Number: Right number shows total positions needed
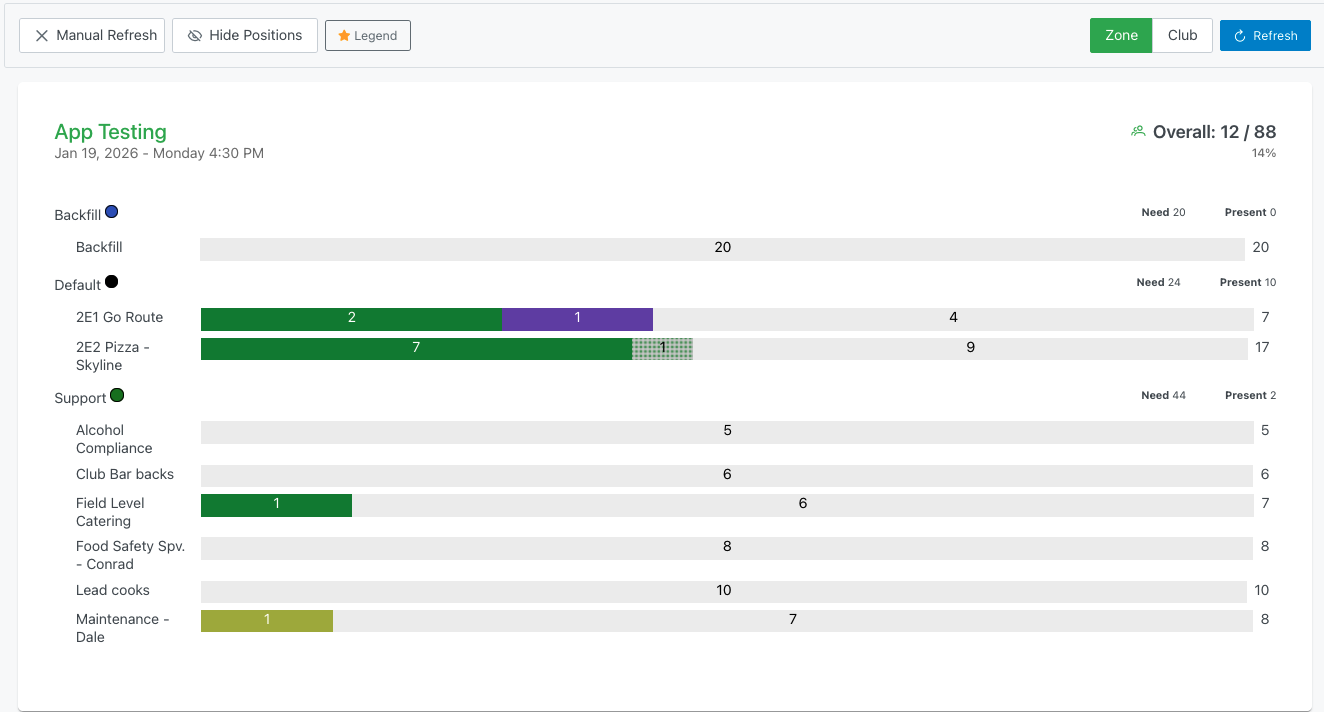
Zone View
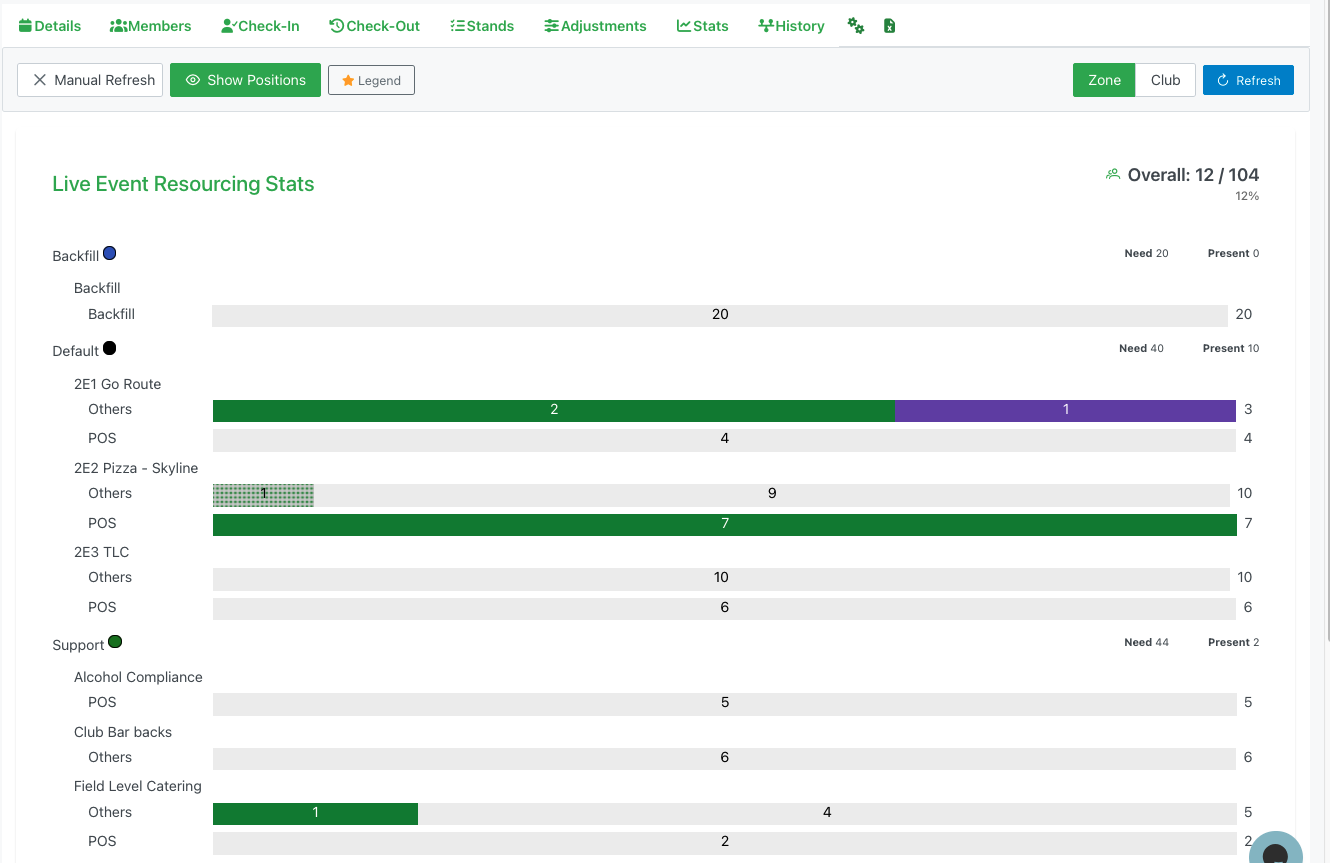
When viewing by Zone, data is organized by zone type:
Zone Level
- Zone Name: Zone classification (e.g., "Backfill", "Default", "Support")
- Status Indicator: Colored dot
- Need: Total positions needed in this zone
- Present: Total resources currently assigned
Stand Level (nested under Zone)
- Stand Name: Stand location within the zone
- Positions: List of positions with progress bars
Position Level
- Same visual representation as Club view
- Shows staffing status with color-coded bars
Interactive Elements
Clickable Progress Bars
Clicking on any progress bar segment opens a detailed popup:
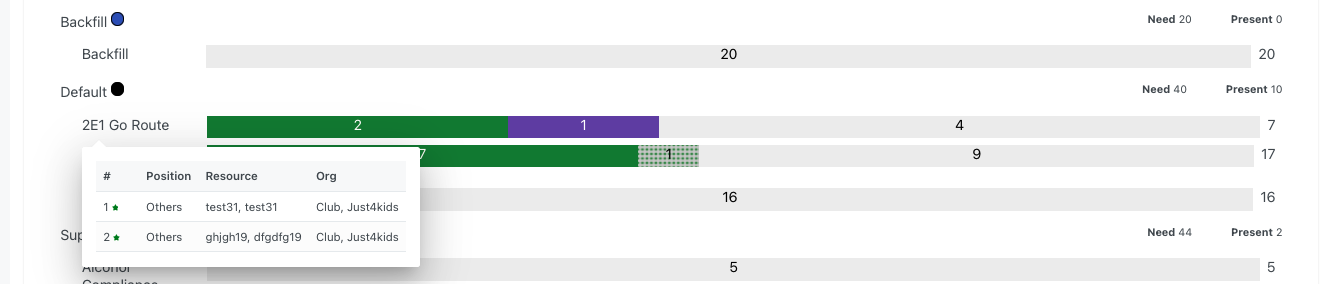
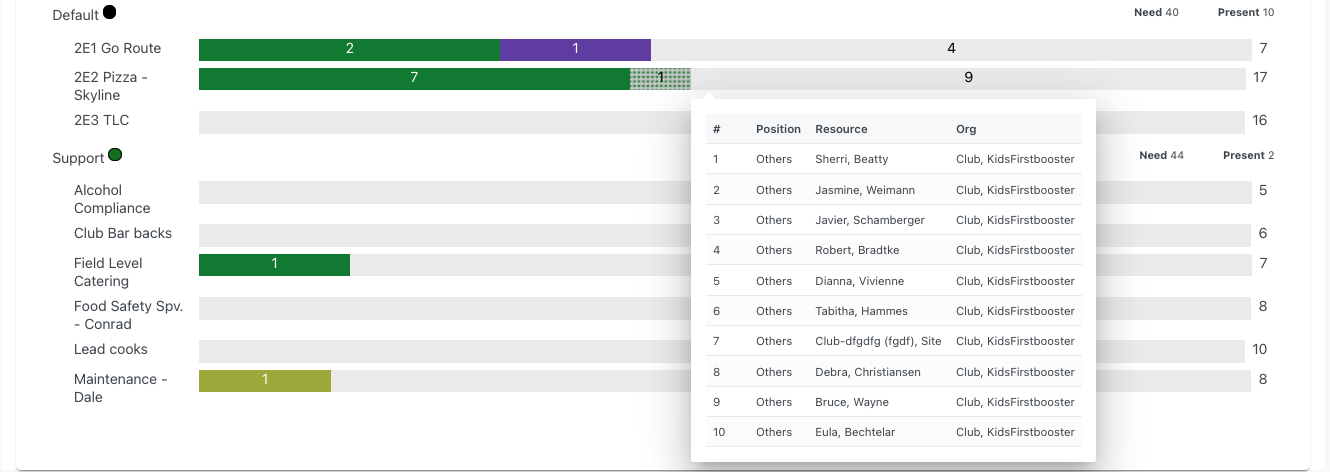
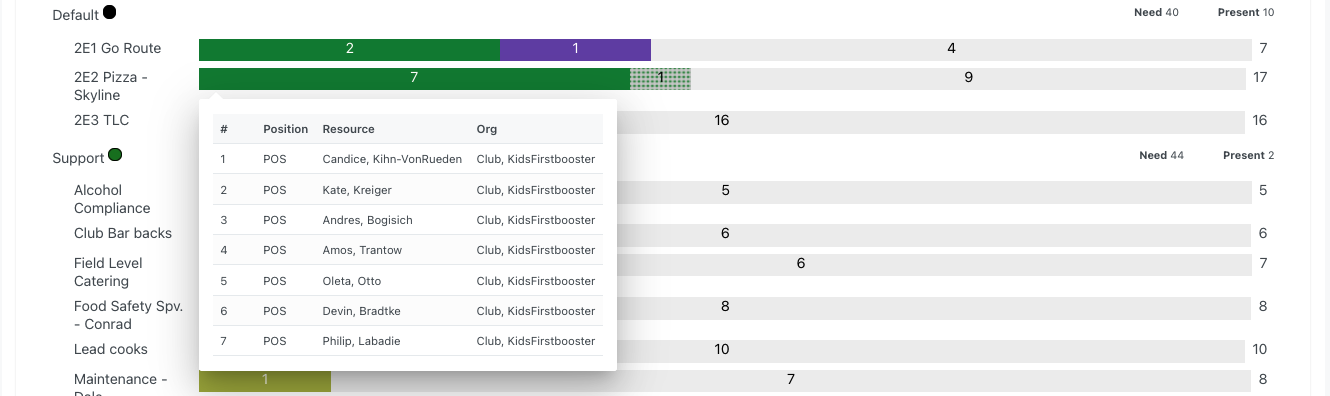
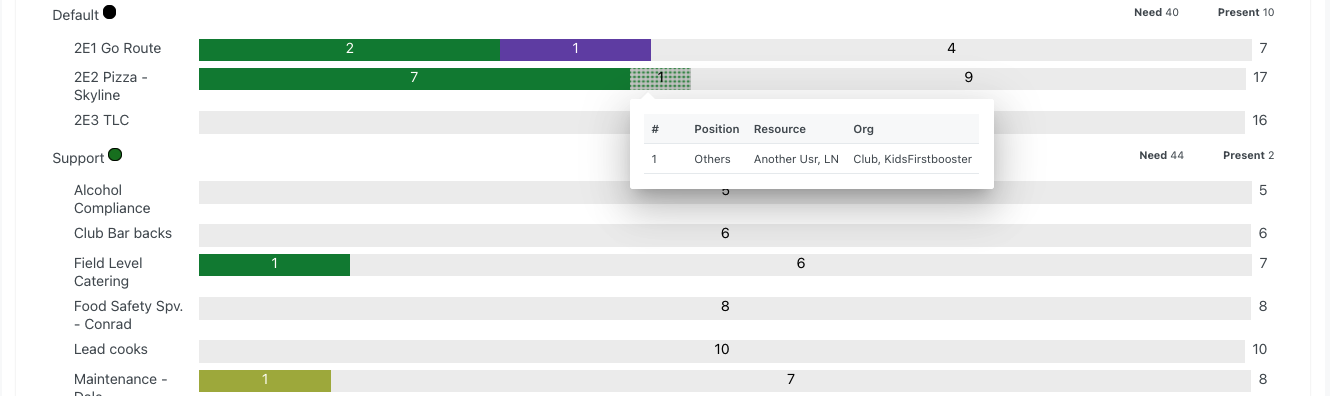
Position Detail Popup
Displays a table of resources assigned to that position:
Table Columns
- #: Position number/sequence
- Position: Role name (e.g., "Others", "POS")
- Resource: Name of assigned member
- Org: Organization/club affiliation
Features
- Shows all resources in that position
- Displays their current status (indicated by the segment color clicked)
- Scrollable list for many resources
- Click outside to close
Stand Summary Popup
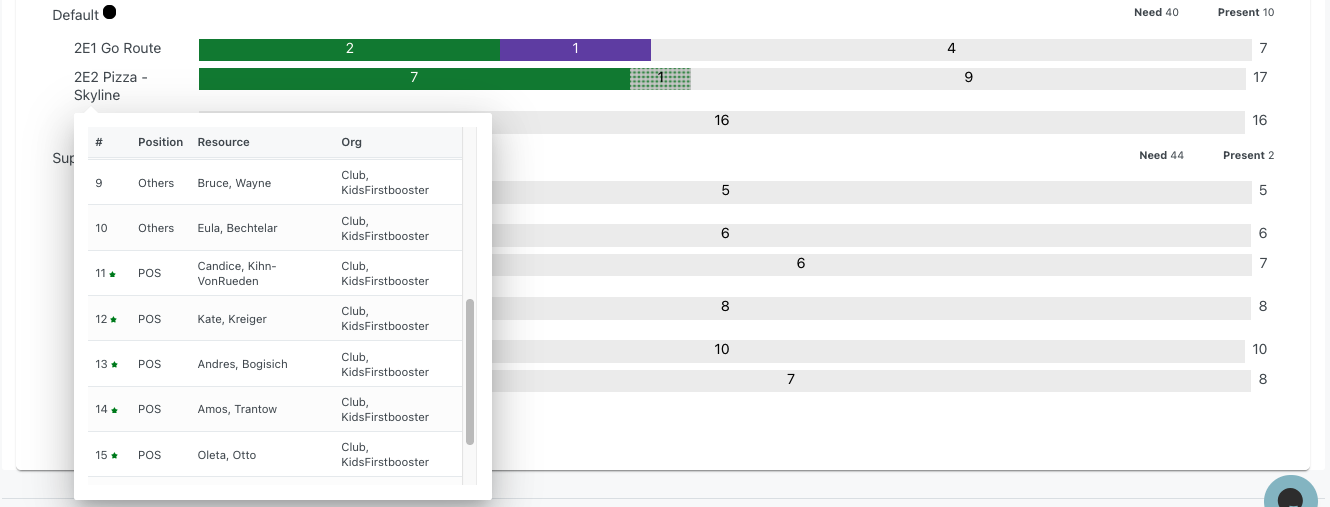
Clicking on a stand name opens a detailed breakdown:
Stand Information
- Stand name as header
- List of all positions within the stand
- Each position shows its progress bar and staffing numbers
Expandable Positions
- Click on any position row to expand
- Shows detailed resource list with names and organizations
- Collapse to return to summary view
Legend
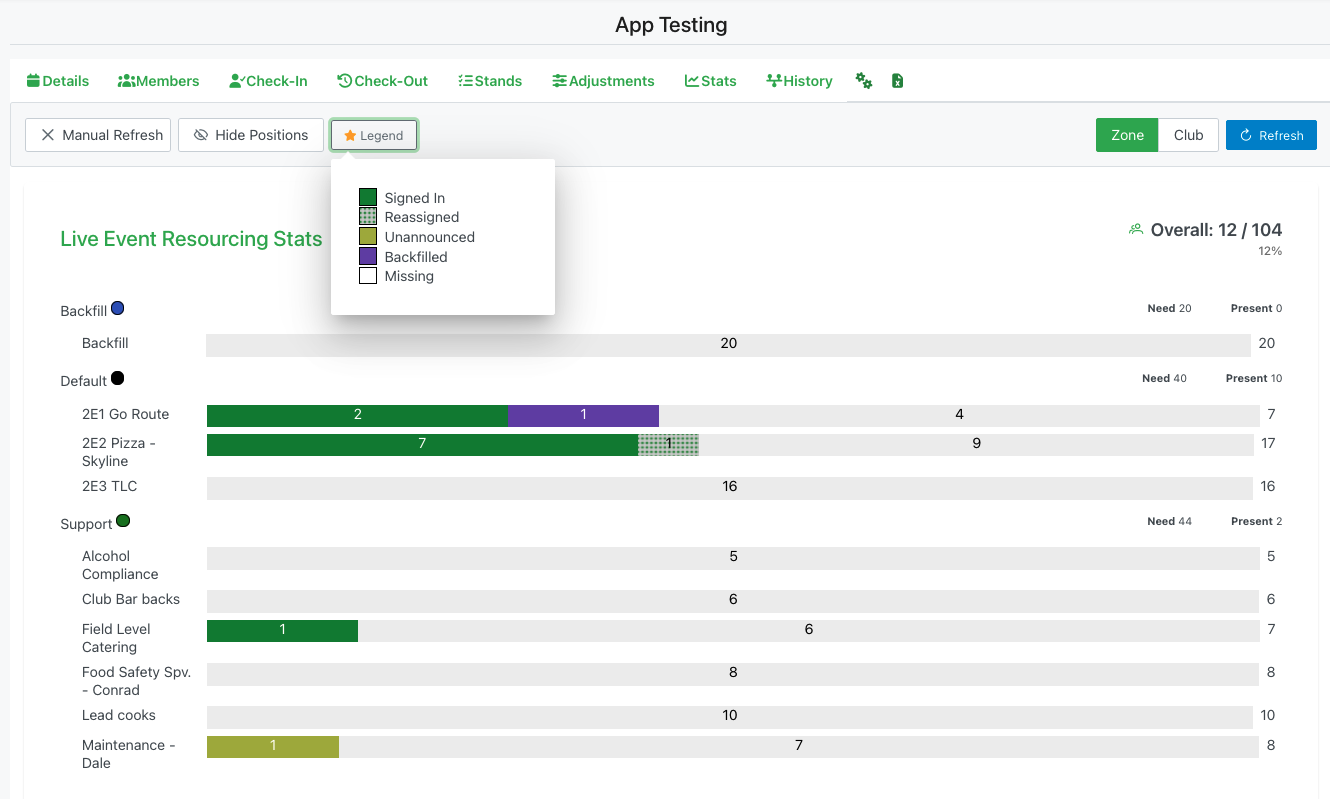
Clicking the "⭐ Legend" button displays a popup explaining the color codes:
Status Colors
- 🟢 Signed In: Resources who checked in normally (solid green)
- ▦ Reassigned: Resources moved to different positions (diagonal stripes)
- 🟡 Unannounced: Walk-up volunteers not originally scheduled (yellow)
- 🟣 Backfilled: Last-minute assignments from adjustments (purple)
- ⬜ Missing: Unfilled positions or no-shows (white/gray)
Understanding the Visual
- Progress bars use these colors to show composition
- Each color segment is proportional to the count
- Numbers on the bar show totals for quick reference
Real-Time Updates
Manual Refresh Mode
- Click "✕ Manual Refresh" to stop automatic updates
- Click "🔄 Refresh" button to update manually
- Useful for taking screenshots or detailed review
Automatic Mode (default)
- Data refreshes automatically at set intervals
- Shows live changes as resources check in/out
- Adjustments reflect immediately
Hierarchical Navigation
Collapsible Structure
- Clubs/Zones can be collapsed to reduce clutter
- Stands nest under their parent organization
- Positions nest under stands
- Click to expand/collapse any level
Scroll Behavior
- Long lists scroll vertically
- Position bars remain visible while scrolling
- Headers stay in view for context
Data Interpretation
Progress Bar Segments
Each bar is divided into segments representing different resource types:
- Left to Right: Shows progression of staffing
- Length: Proportional to number of resources
- Color: Indicates resource status
- Number: Total count for that segment or total
Need vs. Present
- Need: Total positions required
- Present: Resources currently assigned/checked-in
- Gap: Difference shows shortfall or surplus
Percentage Calculation
- Overall percentage = (Present / Need) × 100
- Updated in real-time as status changes
- Helps track progress toward full staffing
Use Cases
Monitor Staffing Levels
- Quick visual overview of event coverage
- Identify understaffed areas at a glance
- Track improvement as more resources arrive
Identify Problem Areas
- Large gray segments show major gaps
- No-shows visible as missing segments
- Can drill down to specific positions
Track Backfill Success
- Purple segments show adjustment effectiveness
- Compare backfilled vs. original assignments
- Verify adjustments are working
Analyze by Zone/Club
- Switch views to identify organizational patterns
- See which clubs are fully staffed
- Determine which zones need more resources
Real-Time Decision Making
- Live data supports quick decisions
- Identify where to send available resources
- Prioritize areas with critical shortages
Best Practices
Regular Monitoring
- Check stats periodically during the event
- Look for changes in staffing levels
- Identify trends or patterns
Use Both Views
- Club view shows organizational accountability
- Zone view shows geographic coverage
- Switch between them for different insights
Drill Down When Needed
- Click bars to see specific resources
- Verify assignments are correct
- Identify individual issues
Coordinate with Other Tabs
- Use with Check-In tab to process arrivals
- Reference Adjustments tab to fix gaps
- Cross-reference Members tab for assignments
Share Status
- Take screenshots for stakeholder updates
- Use Manual Refresh mode for stable views
- Reference percentage for overall status reports
Act on Insights
- Large missing segments = priority for backfill
- Unannounced resources = potential for reassignment
- Reassigned segments = verify communication happened
Color Code Quick Reference
- Solid Green = Checked in and assigned as planned
- Diagonal Stripes = Reassigned to different position
- Solid Yellow = Unannounced walk-up volunteer
- Solid Purple = Backfilled through adjustments
- White/Gray = Missing (no-show or unfilled)
The Stats tab is essential for maintaining situational awareness during live events, enabling quick response to staffing challenges and ensuring adequate coverage across all positions.